
In this post we are going to go through the main JMeter features, but first of all, what is JMeter? basically, it is a tool to perform load testing against:
- Web – HTTP, HTTPS APIs
- Webservices (SOAP or REST)
- FTP
- Database via JDBC
- LDAP
- JMS services
- Native commands or shell scripts
- TCP
- Java Objects
However, we will only cover the HTTP functionalities of JMeter.
Performance tests are required to make sure your application will not crash under heavy traffic, and survive dates such as Black Friday or Christmas. Therefore, it is a very important phase of the web development process.
JMeter is an open source and Java based that provides an GUI to create your test plans, and simulates browser behavior by sending customized request to your website.
JMeter
Installation and Execution
Ubuntu 18
- Download binaries from Apache JMeter.
-
Unzip file:
tar -xf apache-jmeter-5.0.tgz -
Run executable file:
 cd apache-jmeter-5.0/bin
 ./jmeter
MAC OS
-
Install it with brew
brew install jmeter -
jmeter should be on your
PATHjmeter
Elements of a Test Plan
This parent object will contain all the necessary components to build your test plan.
Thread Group
Thread Group is the first element of your test plan and all samples, controllers and listeners are meant to be under this object. However, listeners are allowed to be under the Test Plan object, and in this case they are applied to all Thread Groups. What can you do from a Thread Group?
- Set number of threads or users.
- Set the time for JMeter to run all threads, or in other words, it is the time needed by JMeter to add all users (threads) to the test execution. If you set this value to 100 and the number of users is 10, it will add a user every 10 seconds.
- Set how many times a Thread Group will execute.
- Other options: scheduler, delays, actions after error…
Controllers
Sampler
This type of controller let you send different types of requests (e.g. HTTP, FTP, JDBC…).
The HTTP Request controller is used to send requests to the web server.
If you are planning to send multiple request to the same server it is recommended to use Config Element components for your Thread Group, so you can set default request values:
- Defaults allows you to specify default values for your HTTP calls (e.g. domain, port, parameters, body…) inside a Thread Group or for the whole Test Plan.
- HTTP Header Manager: allows you add or override HTTP request headers.
- HTTP Cookie Manager: stores and sends cookies like a web browser. It is very useful to keep the same session in a Thread Group.
- HTTP Cache Manager: To simulate browser cache features and with the default JVM value, the limit is 5000 items.
- HTTP Authorization Manager: for web pages with restricted access.
Another interesting option to generate test samplers automatically is HTTP(S) Test Script Recorder.
Logic Controller
We can use these controller to specified how and when to run the samplers. The most relevant types are:
- Simple Controller: for organization purposes only.
- Loop Controller: To loop through an object a particular number of times. If you set the value to -1 it will loop forever.
- Once Only Controller: runs what is inside once per thread.
- Interleave Controller: alternate among each controller. If you use it with a Loop Controller it will run a different controller for each iteration.
- Random Controller: it is like the interleave controller but without an order.
- Random Order Controller: it is like Simple controller but without an order.
- Throughput Controller: it controls how often a controller is executed.
- Runtime Controller: it sets for how long the children controllers will run.
- Recording Controller: it is a placeholder to use in combination with HTTP(S) Test Script Recorder.
Listeners
Listeners are essential to retrieve the results from your tests and analyze the Sampler requests and responses by looking at tables, graphs, trees, statistics… Moreover, they allow you to save the results in csv or xml files, so you can have a look at them later.
Some of the most relevant listeners are:
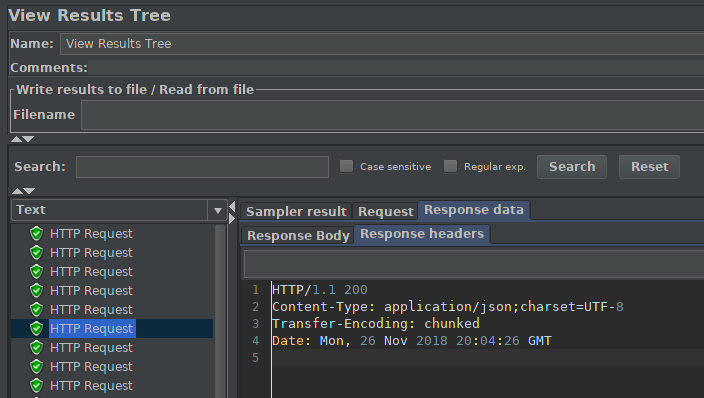
- View Results Tree: this listener shows requests and responses to see if something went wrong during the calls. Since it consumes a lot of resources, it is only recommended to use for debugging purposes.
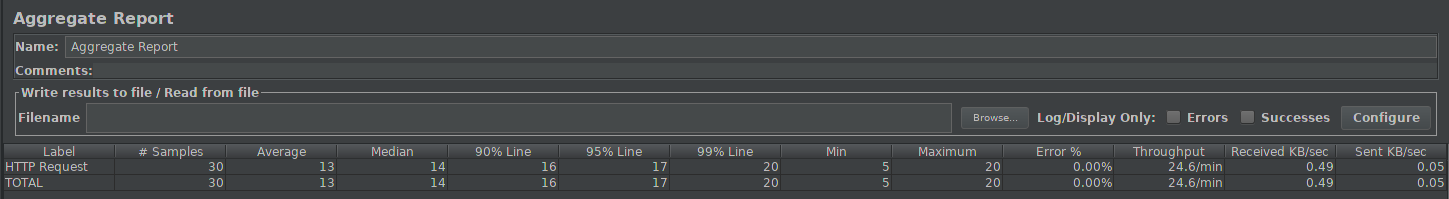
- Aggregate Report: gives you some statistics parameters (average, median, min, max, 90th percentile…) in form of a table.
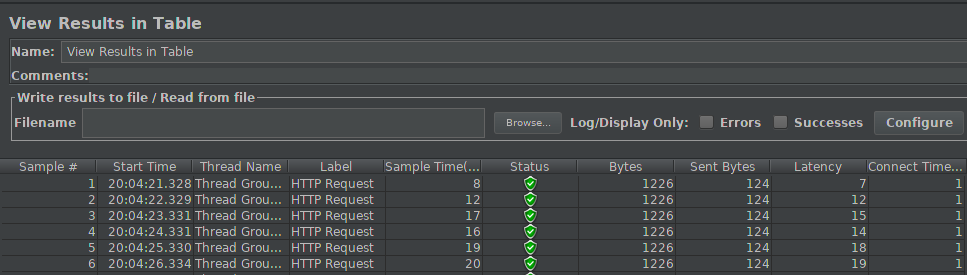
- View Results in Table: creates a row for every sample result, so you can see in depth what is happening during each result. Bear in mind that this listener also consumes a lot of memory.
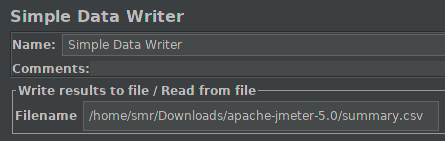
- Simple Data Writer: this is the most performance listener, since the only thing it does it is write the metrics in a external file.
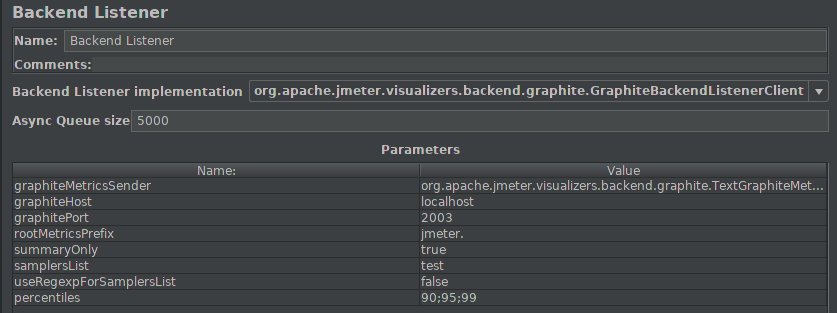
- Backend Listener: you can even push data to your Graphite server. You can try this listener by running a dockerized version of Graphite.

In order to save these reports into CSV files you only need give a path a filename. For XML output Save as XML option needs to be selected in Configure.
Timers
Timers add delays to every requests of your Thread Group to avoid overwhelming the server. If you want to apply a timer to only one element, add the timer as a child of it. Some of the common timers are:
- Constant Timer: it delays each call for the same amount of time.
- Uniform Random Timer: it delays each request for a random amount of time.
- Constant Throughput Timer: this timer uses variable delay for each request base on the server performance, so what you set on this timer is the number of samples per minute.
Assertions
Assertions are very useful to make sure for instance you are getting the expected response.
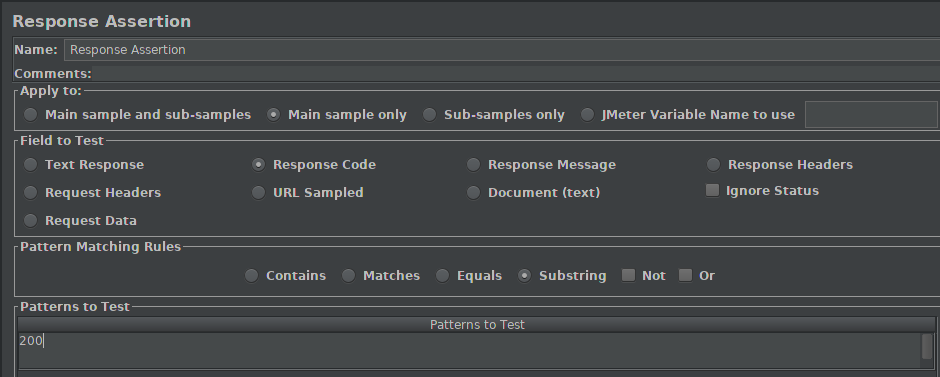
The most relevant assertion for HTTP requests is Response Assertion. This assertion allows you to set patterns for Request and Response Headers, Request Data or Response Message.
Templates
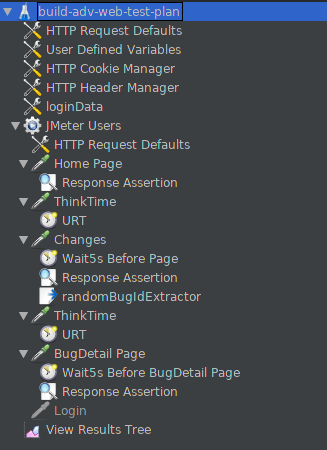
JMeter includes some templates to get started. Building an Advanced Web Test Plan is one of them and includes many of the elements described before (config elements, controllers, assertions, listeners, timers…).
Running Test Plan
There are two options to run your test plan. You can use the GUI provided by JMeter, however this alternative is not recommended, since JMeter consumes much computer memory, and it should only be used for creating the test script. On the other hand, non GUI is much more lightweight and should be used for running the test plan.
jmeter -n -t test_plan.jmx -l results.csv -j jmeter_logs.log
where -n is non-gui mode, -t is Test Plan file, -l file to save results (csv, jtl) and -j JMeter log file.
Conclusion
JMeter is a powerful and customizable tool for load testing, and provides a friendly user interface to create your scripts. However, it is a heavyweight tool compare to other load testing utilities like Gatling or Locust.